Why the 15%-20% Rule Isn’t the Full Answer
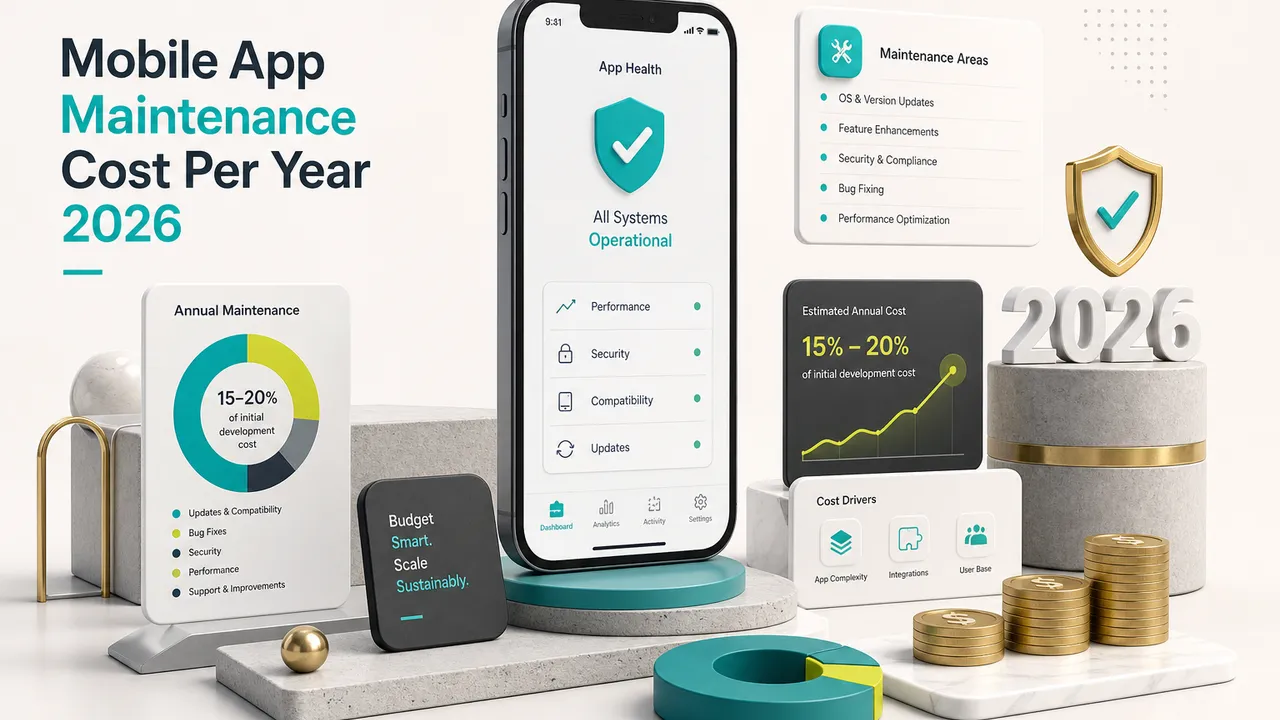
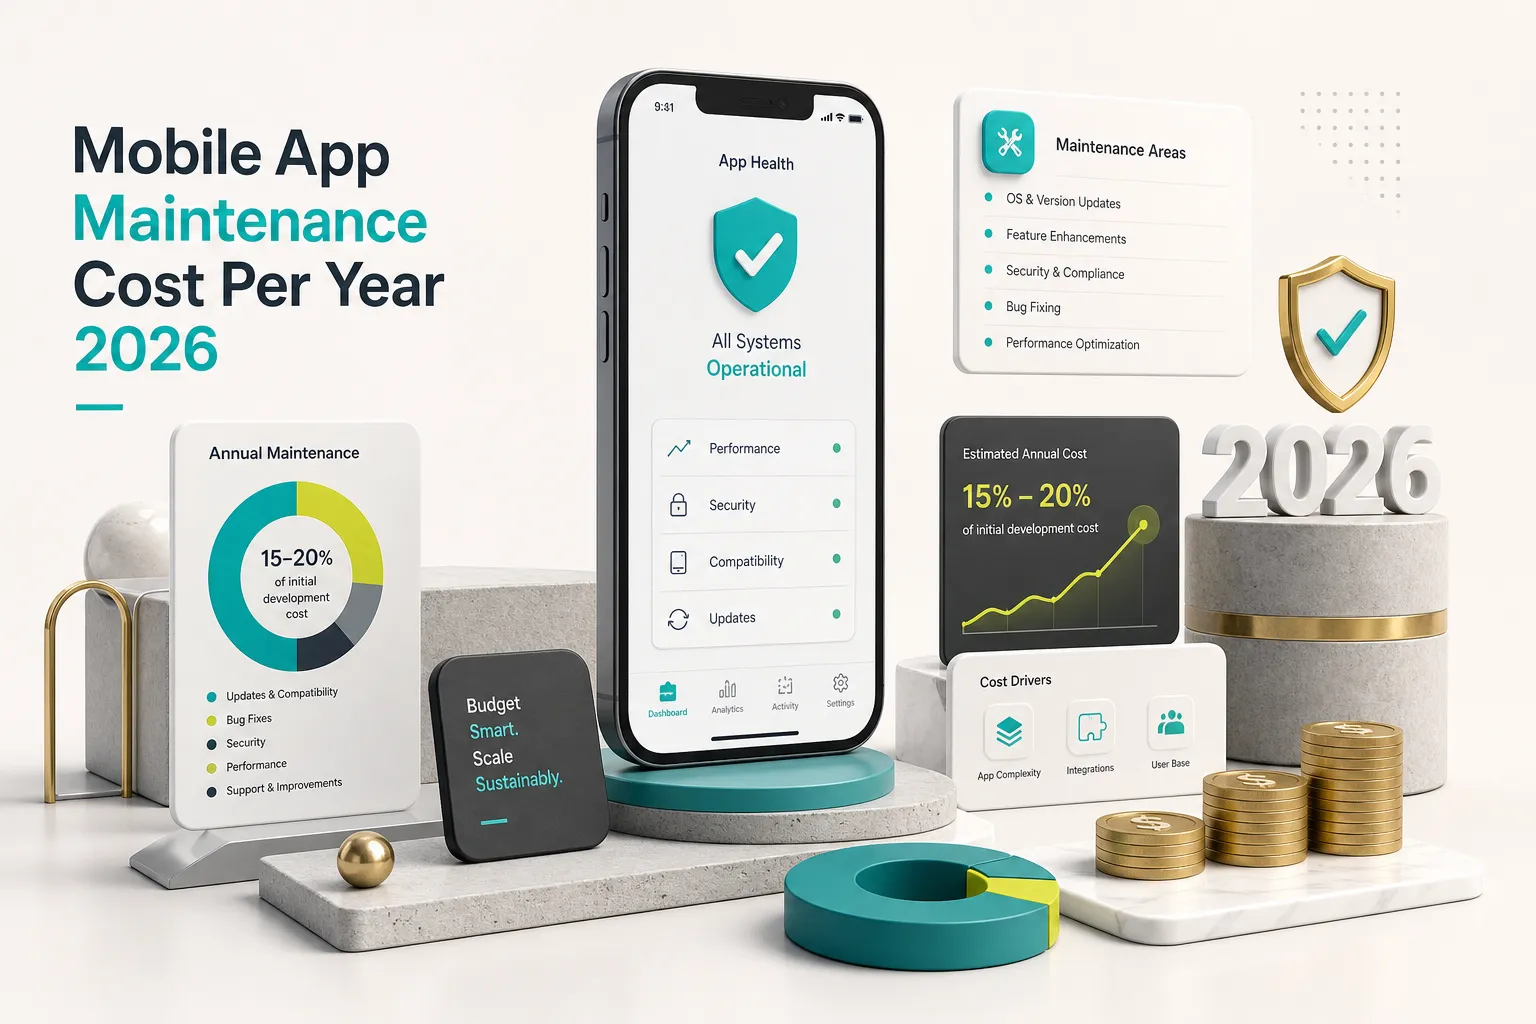
Ask ten agencies what it costs to maintain a mobile app and nine will tell you “15% to 20% of your build cost, annually.” Then they will move on to the next question.
Nobody explains what that percentage actually buys.
Does it include cloud hosting? Crash monitoring subscriptions? A security audit? Who answers the support ticket at 11pm when payments stop processing?
The heuristic exists because it is convenient, not because it is validated. It emerged from enterprise software budgeting decades ago and got copied into mobile blog posts without anyone re-deriving it for a world of monthly OS updates, usage-priced AI APIs, and app store compliance deadlines.
Here is a more honest framing.
Your annual app spend splits into five distinct budget lines: baseline maintenance (keeping the existing app working), infrastructure (hosting, storage, bandwidth, third-party API fees), support (humans answering users and monitoring alerts), compliance (store requirements, privacy, security patching), and new feature development (product growth).
Only the first four belong in a maintenance budget. The fifth is product investment and should be defended as its own line, because the moment you blend them, your feature roadmap silently eats your stability work.
The 15%-25% benchmark is a planning heuristic for a first draft of a budget. When accuracy matters, replace it with an activity- and risk-based estimate.
This guide gives you worked dollar figures for $50,000, $100,000, $200,000, and $500,000 builds, with monthly equivalents.
It shows why year one usually costs more than year three.
And it hands you a line-item structure you can paste into a spreadsheet before your next fiscal planning cycle.
Founders rarely get blindsided by development costs.
They get blindsided by month seven, when the original quote turns out to have covered the build and nothing after it.
What Actually Drives Your Maintenance Bill
Two apps that cost $120,000 to build can have annual maintenance bills that differ by a factor of four.
The build price tells you almost nothing about the running cost.
Four variables do the real work: functional complexity, platform strategy, code quality, and time since launch. Everything else is noise around those four.
Code quality is the one founders underestimate most, because it is invisible in a demo. An app with no automated regression testing, no architectural boundaries, and no documentation forces every future change through manual verification.
A senior developer fixing a checkout bug in a well-tested codebase might spend three hours: reproduce, patch, run the suite, ship.
The same fix in an undocumented codebase with no tests can consume eight to twelve hours, because the developer has to read the surrounding code, manually test five adjacent screens, and pray nothing else broke.
That gap compounds.
If your team ships forty changes a year, poor code quality is not a 10% premium. It is a doubling of your labor line, forever, until someone pays down the technical debt.
Complexity Tiers That Set Your Baseline
Complexity in maintenance terms is not about how many screens you have. It is about how many external systems can fail on you and how much state you have to keep consistent.
- Tier 1, simple: A content or utility app with local storage, basic authentication, and one or two integrations. Nothing runs server-side that you own. Failure modes are limited and mostly cosmetic.
- Tier 2, moderate: User accounts, a backend database, push notifications, analytics, maybe payments or subscriptions. This is where most funded MVPs land. You now own uptime, and you have three or four vendors whose breaking changes become your problem.
- Tier 3, complex: Real-time features, marketplaces with two-sided flows, media processing, offline sync, AI inference, or multiple integrated business systems. Data consistency bugs appear that only surface at scale.
- Tier 4, regulated or high-availability: Health data, financial transactions, identity verification, or contractual uptime guarantees. Add audit trails, penetration testing, vendor security reviews, and formal incident response to everything above.
Each tier roughly doubles the annual baseline effort relative to the one below it, independent of build cost.
A Tier 4 app built cheaply is still a Tier 4 app to maintain.
Native vs Cross-Platform Trade-offs
Platform strategy changes your maintenance math more than most cost guides admit. The comparison is not simply “one codebase is cheaper.”
Two native codebases (Swift and Kotlin) mean every feature change, every bug fix, and every dependency update happens twice. Budget roughly 1.6x to 1.8x the labor of a single codebase, not 2x, because design, backend, and QA planning are shared.
Cross-platform (Flutter, React Native) collapses most of that duplication.
You write business logic once.
But you still test on both platforms, you still handle platform-specific permissions and store rules, and you inherit a framework upgrade cycle that native apps do not have.
Flutter and React Native ship major versions regularly, and staying within a supported version window is non-negotiable if you want security fixes. Skipping two years of framework upgrades turns a routine dependency update into a multi-week migration.
The practical rule: cross-platform typically reduces annual maintenance labor by 30% to 40% versus dual native, provided the team keeps the framework current.
Fall behind, and that saving reverses.
Why Year One Runs Higher
Expect your first twelve months post-launch to cost 30% to 60% more than your steady-state years.
This surprises almost everyone.
The reason is that launch does not end the build. It starts the stabilization phase, where real users find the defects your test devices never did: odd screen sizes, poor network conditions, unexpected input, data states nobody modeled.
On top of defect remediation, year one carries work that was deferred to hit the launch date.
Analytics instrumentation that never got finished. Crash monitoring that needs tuning so the alerts mean something. Dependency updates that were frozen during the final sprint.
There is also the technical debt remediation that any fixed-deadline project accumulates. Shortcuts taken in weeks ten and eleven get paid back in months two through six, and paying them back early is dramatically cheaper than living with them for three years.
By year three, a well-run app settles into a predictable rhythm: OS compatibility updates, dependency patching, occasional bug fixes, and infrastructure that scales with usage.
That is your true baseline.
Real 2026 Cost Ranges for Common Build Budgets
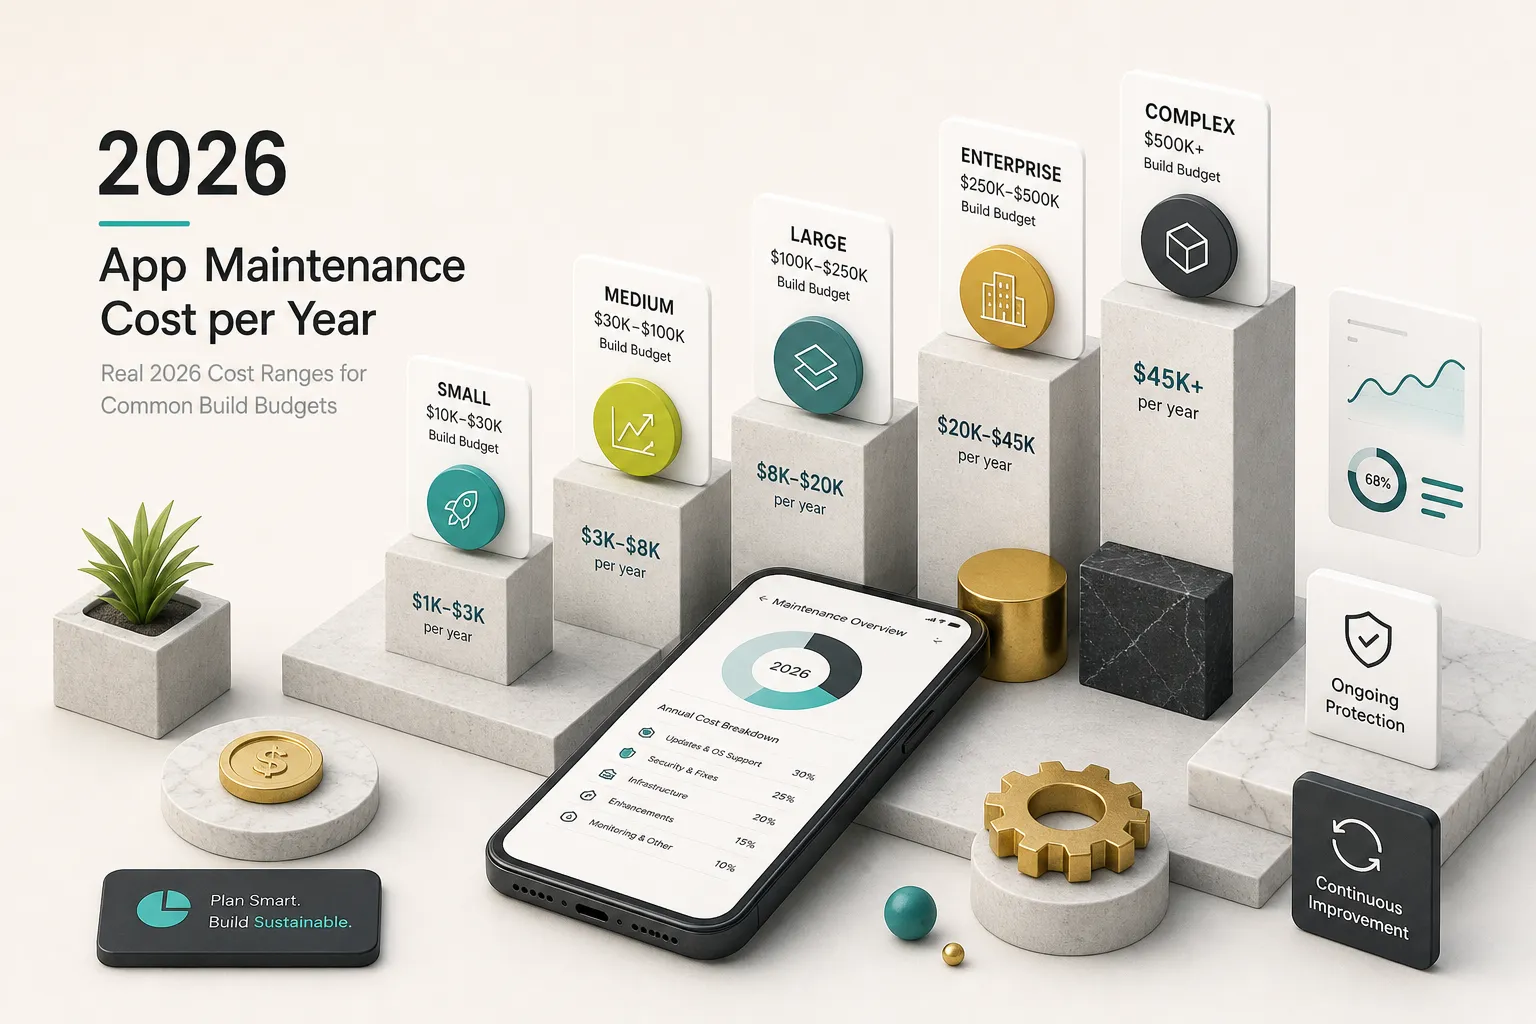
Numbers, finally.
The table below compares what the flat heuristic predicts against what an itemized, activity-based estimate produces for four common build budgets in 2026.
The realistic range assumes a Tier 2 to Tier 3 app on one cross-platform codebase or two native ones, with modest cloud infrastructure, standard monitoring tooling, and business-hours support. It excludes new feature development entirely.
| Initial Build Cost | Flat 15-20% Heuristic | Realistic Activity-Based Range (Year 2+) | Monthly Equivalent | Typical Year 1 Range |
|---|---|---|---|---|
| $50,000 (simple, Tier 1-2) | $7,500 - $10,000 | $9,000 - $18,000 | $750 - $1,500 | $14,000 - $26,000 |
| $100,000 (moderate, Tier 2) | $15,000 - $20,000 | $20,000 - $38,000 | $1,670 - $3,170 | $30,000 - $55,000 |
| $200,000 (complex, Tier 3) | $30,000 - $40,000 | $42,000 - $80,000 | $3,500 - $6,670 | $60,000 - $115,000 |
| $500,000 (enterprise or regulated, Tier 3-4) | $75,000 - $100,000 | $110,000 - $210,000 | $9,170 - $17,500 | $150,000 - $290,000 |
Notice the pattern.
The activity-based range starts where the heuristic ends and goes considerably higher.
That divergence is not because agencies lowball.
It is because the 15% figure was historically quoted as developer labor only, and then people started assuming it covered hosting, monitoring subscriptions, support staffing, and compliance work that did not exist as separate line items twenty years ago.
Regulated apps sit at the top of every band regardless of build size. An app handling payment card data or protected health information carries annual penetration testing ($8,000 to $25,000), vendor security questionnaires, audit log retention, and a formal incident response obligation.
None of that scales down just because the app was cheap to build.
Apps with a contractual service-level agreement add another layer: on-call rotation, redundant infrastructure, and documented recovery procedures. A 99.9% uptime commitment costs meaningfully more than best-effort availability.
A Worked Calculation Example
Take a real scenario.
A $120,000 Flutter marketplace app, launched in early 2025, roughly 40,000 monthly active users, Stripe payments, Firebase backend, push notifications, and business-hours email support.
Here is the year-two budget built from activities rather than percentages:
- Developer labor, 12 hours per month at $85/hour: $12,240. Covers bug fixing, OS compatibility updates, dependency updates, and small adjustments.
- OS release cycle work, 40 hours annually: $3,400. The iOS release cycle lands each September; Android target API level changes have a hard deadline. Both require testing, adjustments, and a compliance release.
- Cloud hosting and database: $4,800. Firebase reads, writes, storage, and functions at this user volume.
- Third-party API fees: $2,900. Push notification service, maps, transactional email, error tracking.
- Monitoring and analytics tooling: $1,800. Crash monitoring and application performance monitoring at a paid tier that retains enough history to be useful.
- Support, 8 hours per month at $45/hour: $4,320. Ticket triage, user responses, store review replies.
- Store and developer accounts: $99. Apple Developer Program annual fee.
- Security: dependency scanning, key rotation, light annual review: $3,500.
- Contingency at 15%: $4,960.
Total: approximately $38,000, or $3,170 per month.
The flat 15%-20% rule would have predicted $18,000 to $24,000, off by nearly half.
Strip out infrastructure and support and you get about $24,000 in pure developer maintenance, which is 20% of build cost.
The heuristic was not wrong.
It was just answering a narrower question than the founder was asking.
What’s Actually In (and Out of) Your Budget
The single most expensive budgeting mistake is treating “maintenance” as a bucket that also absorbs new features.
It never survives contact with a roadmap.
What happens is predictable.
The team has a $3,000 monthly maintenance retainer, the CEO wants a referral system, and the referral system consumes two months of that retainer. Meanwhile the dependency updates sit untouched, the framework version falls out of support, and eighteen months later you are quoting a $40,000 migration.
Draw the line clearly.
Maintenance keeps the app doing what it already does, on current platforms, securely.
Anything that changes what the app does is product development.
Fixed vs Variable Recurring Costs
Your recurring spend has two very different behaviors, and mixing them makes forecasting impossible.
Fixed costs stay flat whether you have 500 users or 50,000. They are easy to budget and easy to forget.
- Apple Developer Program: $99 per year, per organization. Non-negotiable if you want to be on the App Store.
- Google Play Developer account: $25 one-time, paid once at registration. No annual renewal.
- Code signing certificates, domain names, and email services: typically $200 to $800 per year combined.
- Monitoring, crash reporting, and analytics subscriptions at a fixed seat or project tier: $600 to $6,000 per year depending on retention and volume tiers.
- Retainer-based developer availability, if you pay for reserved capacity rather than hours used.
Variable costs track usage, and they are the ones that quietly triple after a successful marketing push.
- Cloud compute, database reads and writes, and storage. Firebase and Supabase both bill on operations, and a poorly indexed query can multiply your bill without changing your user count.
- Bandwidth and CDN, especially for image or video-heavy apps.
- Push notifications above free tiers, SMS, and transactional email volume.
- Maps, geocoding, and place lookups, which are priced per request and are a classic source of surprise invoices.
- Payment processing fees, which are revenue-linked rather than user-linked.
- AI API calls. Token-based pricing from OpenAI or Anthropic can be the largest variable line in an AI-integrated product, and it scales directly with engagement.
Model your variable costs at three user levels: current, 3x, and 10x. If 10x growth produces an infrastructure bill you cannot absorb, that is an architecture problem to solve now, not a billing surprise to discover later.
Security and Compliance Maintenance
Security maintenance is not “we fix bugs.” It is a distinct set of scheduled activities with its own budget.
Dependency scanning and patching is the highest-value item.
Most mobile apps carry 40 to 150 transitive dependencies, and vulnerability disclosures in that tree arrive continuously. Automated scanning plus a monthly triage window handles the majority of exposure for a few hours of labor.
Certificate and key rotation has a hard deadline attached. Expired push notification certificates, API keys, and signing credentials cause complete feature outages, and they always expire on a weekend.
Then there is store compliance, which has become a real engineering cost rather than a paperwork exercise.
Google Play requires new apps and app updates to target Android 16 (API level 36) beginning 31 August 2026, with separate availability requirements applying to existing published apps. Apple enforces its own SDK minimums alongside each iOS release cycle, typically with a spring deadline.
Privacy declarations add ongoing work too: App Store privacy nutrition labels, Google Play Data Safety forms, and third-party SDK privacy manifests all need updating whenever you add or remove a dependency.
For regulated categories, add annual penetration testing, authentication policy reviews, audit log configuration, and vendor security assessments. Budget $10,000 to $40,000 annually for a serious compliance posture, and treat it as insurance rather than overhead.
New Features Are a Different Line Item
Product development deserves its own budget with its own approval process. Blending it into maintenance guarantees both get underfunded.
Items that belong in a product budget, not a maintenance budget:
- New user-facing features and new screens.
- Visual redesigns and brand refreshes, even when they touch existing screens.
- Backend migrations driven by growth, such as moving from a serverless database to a managed Postgres cluster.
- Scaling work: caching layers, queue systems, read replicas. These are triggered by success, not by decay.
- New platform expansion, such as adding a tablet layout, a web app, or a wearable companion.
A reasonable planning split for a growing product is 60% product development, 40% maintenance and infrastructure.
For a mature app in harvest mode, invert it.
Running a Sustainable Maintenance Program
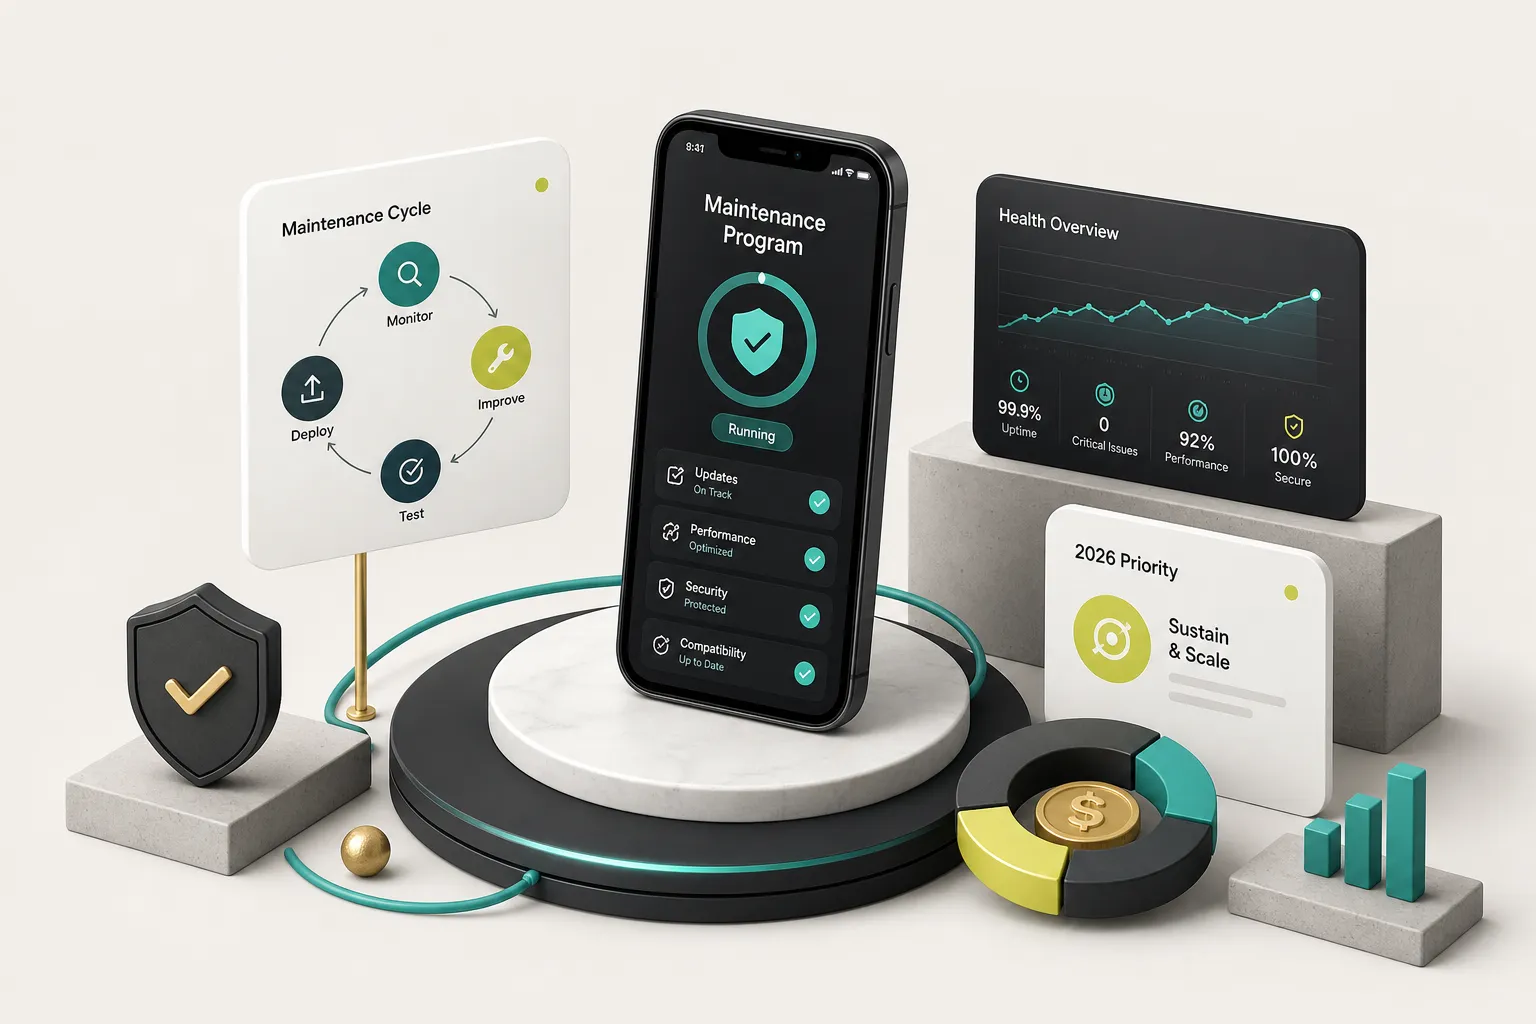
Emergency work costs two to three times what scheduled work costs. Same fix, same developer, wildly different price, because urgency destroys efficiency and forces context switching.
The single highest-leverage move in maintenance budgeting is converting unplanned work into planned work. That is what a maintenance calendar and disciplined release management actually buy you.
Teams that ship on a predictable cadence, monthly or biweekly, accumulate less risk per release.
Small releases are easy to diagnose when something breaks. A quarterly release that bundles thirty changes turns every crash report into a hunt.
Release discipline is a cost control mechanism, not a process preference. Frequent small releases reduce the average cost of a defect because the search space for its cause stays small.
An Annual Maintenance Calendar
Here is a working calendar you can adopt directly. Each item has a cadence, an owner, and a rough time cost.
- Monthly: dependency and vulnerability review. Run automated scanning, triage findings, patch anything with a known exploit. Two to four hours for a typical Tier 2 app.
- Monthly: crash and performance review. Read your crash monitoring dashboard, check crash-free session rate against target (aim for 99.5% or better), and fix the top two contributors. Three to six hours.
- Monthly: support and analytics readout. Review ticket themes and mobile app analytics funnels. This is where you spot a broken flow before it becomes a review-score problem.
- Quarterly: infrastructure cost audit. Compare cloud hosting and third-party API fees against the previous quarter. Investigate any line that grew faster than user count.
- Quarterly: automated regression testing maintenance. Test suites rot. Fix flaky tests and extend coverage to whatever shipped last quarter, or the suite stops being trusted and gets skipped.
- Quarterly: technical debt remediation sprint. Reserve 10% of engineering capacity explicitly for refactoring and documentation. Skipping this is the most common cause of year-four cost explosions.
- June to July: Apple beta testing. Install the iOS beta, run your app, log breakage. Doing this in July costs a fraction of doing it in September under pressure.
- September to October: iOS release cycle response. Ship a compatibility release within four weeks of the public iOS launch. Budget 20 to 40 hours.
- Q1 to Q2: Android target API level upgrade. With the API 36 deadline landing on 31 August 2026, target the upgrade for spring so you are not filing an extension request in August. Budget 20 to 50 hours depending on how many SDKs need updating.
- Annually: security review and credential rotation. Rotate keys and certificates, review authentication policies, commission penetration testing if your category warrants it.
- Annually: privacy declaration refresh. Update App Store privacy labels, Google Play Data Safety disclosures, and SDK privacy manifests to match your actual current data flows.
- Annually: SDK end-of-life audit. List every third-party dependency and check its support status. Deprecated SDKs are the seed of the expensive migrations that hit in year four.
Cutting Costs Without Cutting Corners
Some savings are real.
Others are loans against your future self at a terrible interest rate.
Genuinely effective reductions:
- Consolidate your platform strategy. One well-maintained cross-platform codebase beats two half-maintained native ones for most product categories.
- Invest in automated regression testing early. A suite covering your critical paths pays for itself within three to four release cycles by removing manual QA hours.
- Reduce dependency count. Every SDK is a future upgrade obligation, a privacy disclosure, and a potential vulnerability. Ask whether a 30-line implementation beats a 3MB library.
- Right-size your infrastructure. Query optimization and caching frequently cut cloud bills by 40% to 70% at no functional cost.
- Write documentation while context is fresh. A README that explains the architecture saves every future developer their first two days.
False economies that cost more later:
- Skipping OS compatibility updates. Miss a store deadline and you cannot ship updates at all, which turns a routine task into an emergency.
- Cancelling crash monitoring to save $100 a month. You then discover problems from one-star reviews instead of dashboards.
- Choosing the cheapest hourly rate available. A developer unfamiliar with your codebase bills three times the hours a familiar one does.
- Deferring all technical debt indefinitely. This works until it does not, and the failure mode is a full rebuild.
A note on the total cost of ownership view: over a typical five-year life, cumulative maintenance and infrastructure commonly reach 100% to 180% of the original build cost. Planning for that from day one changes which architecture decisions look sensible in month one.
Frequently Asked Questions
How much does it cost to maintain an app annually?
Most apps cost between $9,000 and $210,000 per year to maintain in 2026, depending on complexity and build size. A simple Tier 1 app built for around $50,000 typically runs $9,000 to $18,000 annually, while a complex or regulated app built for $500,000 runs $110,000 to $210,000.
These figures cover baseline maintenance, infrastructure, monitoring, and support, but exclude new feature development.
What percentage of development cost is maintenance?
Developer labor for maintenance typically runs 15% to 25% of build cost annually, but total annual ownership cost is usually 20% to 40% once hosting, third-party API fees, monitoring tools, support, and compliance are itemized. The lower figure is where the traditional heuristic comes from.
Use it for a rough first pass, then replace it with an activity-based estimate before you commit to a budget.
How much does it cost to maintain an app per month?
Monthly maintenance costs typically range from $750 for a simple app to $17,500 for an enterprise or regulated application. A moderate Tier 2 app built for $100,000 usually sits between $1,670 and $3,170 per month.
Expect the first twelve months after launch to run 30% to 60% above these figures because of stabilization work and deferred instrumentation.
What is included in app maintenance?
Baseline app maintenance includes bug fixing, OS compatibility updates for new iOS and Android releases, dependency updates, security patching, crash monitoring, application performance monitoring, store compliance work, and release management. Most maintenance agreements also cover cloud hosting oversight and user support triage.
New features, redesigns, and growth-driven scaling are separate line items and should be quoted separately.
How much does it cost to update an app?
A routine compatibility or bug-fix update typically costs $1,500 to $6,000 in developer time, including testing and store submission. A major OS compatibility release tied to the iOS release cycle or the Android target API level requirement usually runs 20 to 50 hours, or roughly $2,000 to $6,000 at common rates.
Feature updates are priced by scope and fall outside maintenance budgets entirely.
Is app maintenance necessary?
Yes, app maintenance is mandatory, not optional, because both app stores enforce technical deadlines that will block your updates if ignored. Google Play requires new apps and updates to target Android 16 (API level 36) starting 31 August 2026, and Apple enforces SDK minimums alongside each annual iOS release.
An unmaintained app also accumulates unpatched security vulnerabilities and gradually breaks as its third-party dependencies are deprecated.
How much does it cost to maintain an app on the App Store and Google Play?
Store fees themselves are minimal: the Apple Developer Program costs $99 per year and a Google Play Developer account costs $25 one-time. The real store-related cost is engineering work to meet compliance requirements, which typically runs $3,000 to $10,000 annually across both platforms for OS compatibility updates, privacy declarations, and policy-driven changes.
Both stores also take a commission on in-app purchases, generally 15% to 30% depending on your revenue tier and program eligibility.
What is the average lifetime cost of a mobile app?
Over a five-year life, cumulative maintenance and infrastructure commonly total 100% to 180% of the original build cost. A $100,000 app therefore has a realistic five-year total cost of ownership between $200,000 and $280,000 before any new feature development.
Add a modernization or major migration event in year four or five, and that figure climbs further.
The One Number to Budget This Year
If you need a single planning figure right now, use this.
Simple app, stable product, small user base: budget 20% of build cost plus a 15% contingency, and you will be close enough to start.
Everyone else should not use a percentage at all.
If you handle payments, health data, identity, or real-time interactions, or if you carry a service-level agreement, build the estimate from activities: labor hours, infrastructure at projected usage, support coverage, security work, and compliance deadlines.
Percentages fail precisely where the stakes are highest.
The actionable step is small and takes an afternoon.
Open a spreadsheet and create nine rows: developer labor, OS release cycle work, cloud hosting, third-party API fees, monitoring and analytics tooling, support, developer accounts, security and compliance, contingency.
Fill each one with a real number and a source.
That sheet will beat any industry percentage, because it reflects your app rather than an average of everyone else’s.
One last reframe.
Maintenance is not a tax on having shipped something.
A well-maintained app ships features faster, survives OS transitions without drama, and holds its ratings while competitors quietly rot. The money you spend keeping the foundation sound is what makes everything you build on top of it cheaper.